Figure Gallery
Representative images and animations from pyCyto analyses. All data shown here are from cytotoxicity assays described in the associated paper.
Live-Cell Microscopy Animations
eGFP-tagged NY-ESO-1 tumor cells (green) targeted by engineered T cells (red). PI death marker shown in blue. Confocal 2D time-lapse.
Dynamic cell clustering network visualized over time during immune cell–tumor interactions. Nodes represent cells; edges represent contacts.
High-throughput imaging of cytotoxic events across a large imaging region using lightsheet microscopy.
Close-up of lightsheet data highlighting immune–tumor cell contacts. Green: eGFP NY-ESO-1 cancer cells; Magenta: target-specific engineered T cells.
Confocal Cytotoxicity Paper — Key Images
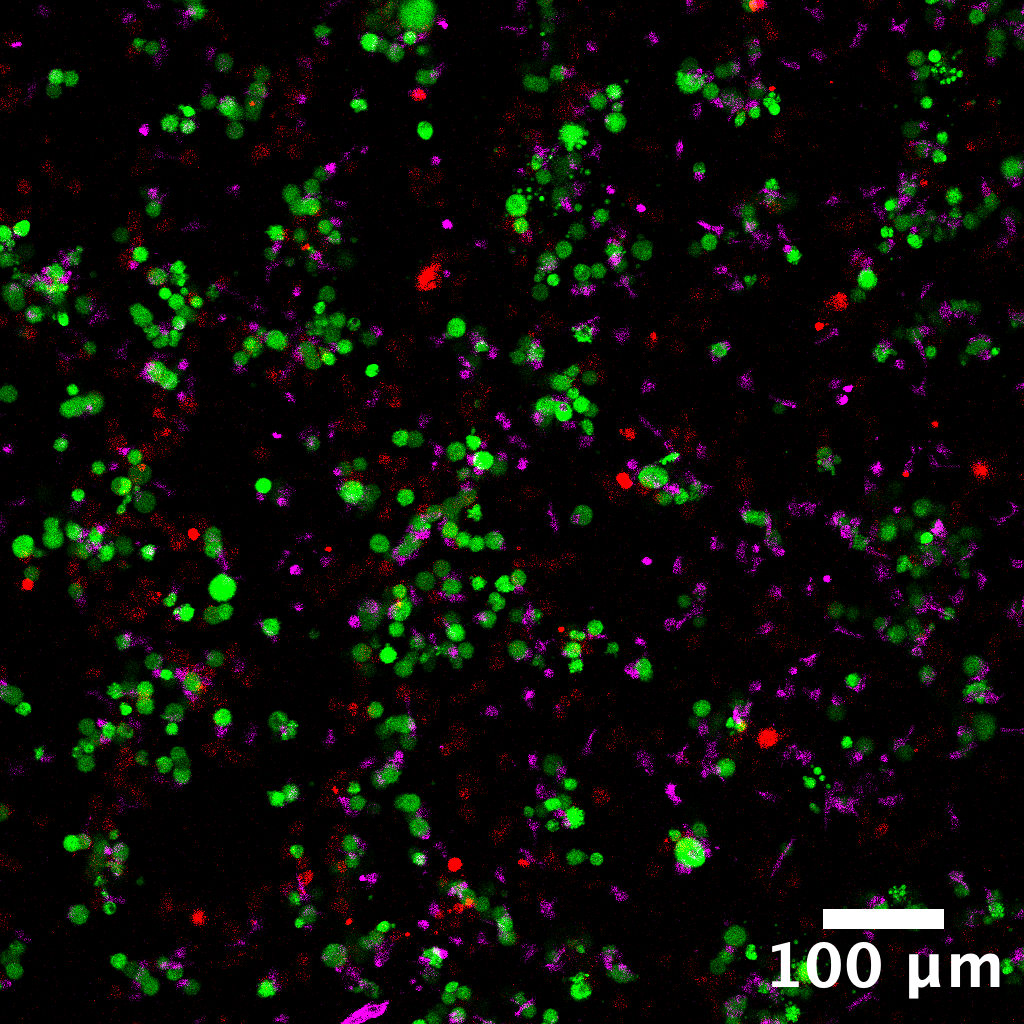
Full-field composite image with scale bar. Channels: T cells (red), cancer cells (green), PI death marker (blue).
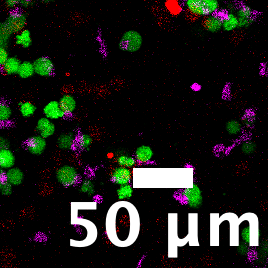
Cropped region of interest showing a representative killing event with scale bar.
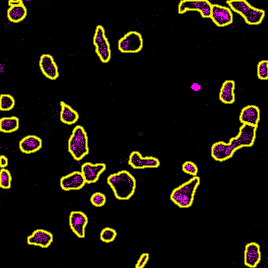
Cellpose segmentation labels overlaid on the T cell channel (cropped). Each colored region is one detected T cell.
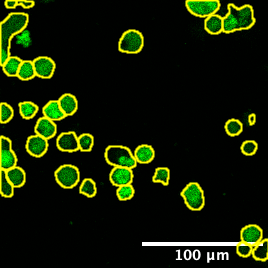
Cellpose segmentation labels overlaid on the cancer cell channel (cropped). Labels are used for PI intensity measurement.
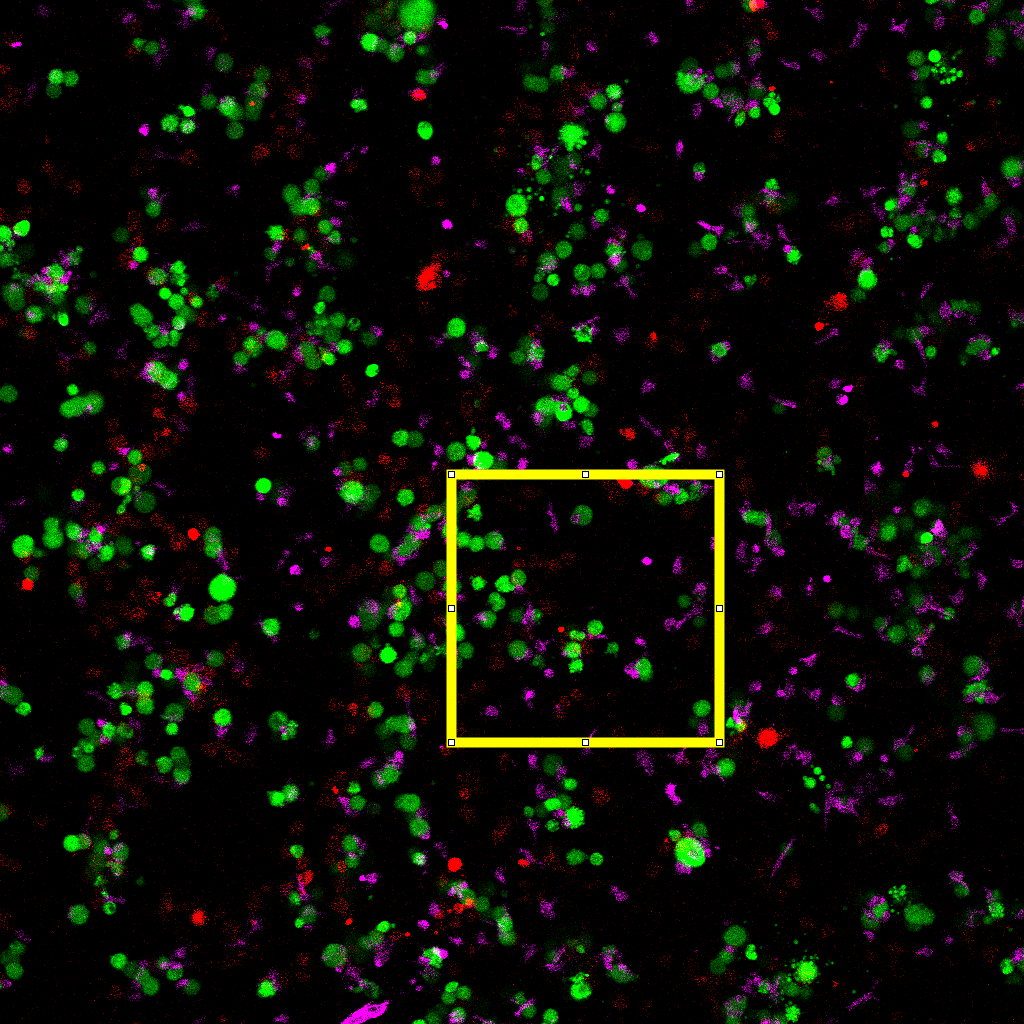
Composite image with annotated region of interest used for contact analysis.
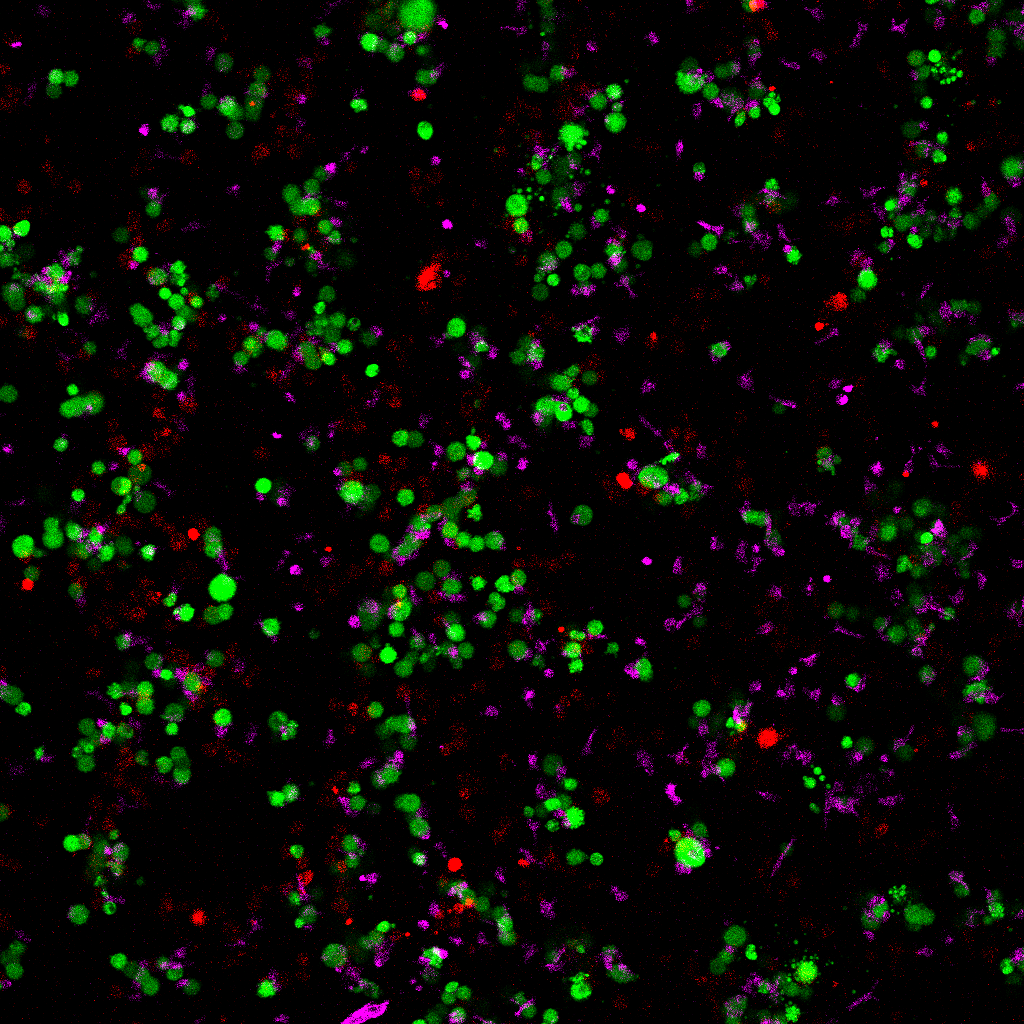
Full-field composite without scale bar — suitable for downstream figure assembly.
Vesicle Tracking Paper — Key Results

Mean squared displacement (MSD) curves across lag times. Used to characterise vesicle transport modes (directed, diffusive, confined).

Channel-averaged fluorescence intensity traces over the full time-lapse. Shows signal dynamics during vesicle loading and release events.
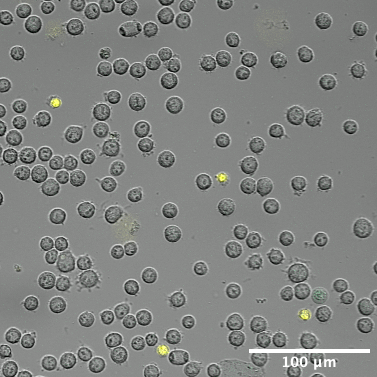
Representative cropped field at t=1. Scale bar overlay shows spatial reference for vesicle size estimation.
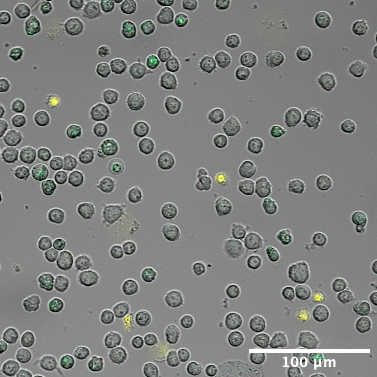
Representative cropped field at t=201 — mid-experiment state showing vesicle redistribution.
Notes
Animations (GIFs) are Git LFS-managed files under
doc/assets/.Paper images (PNGs/SVGs) are committed to
doc/assets/gallery/— no LFS required.Full vesicle tracking notebooks:
notebooks/05_vesicle/.