Benchmark — Horizontal Scaling Performance
pyCyto includes a reproducible 4-stage benchmark suite that measures wall-time speedup as the number of parallel SLURM workers increases from N=1 to N=8.
Running the Benchmark
# Configure: copy defaults and override dataset root, GPU gres, frame count
cp scripts/benchmark/config/benchmark.def.toml scripts/benchmark/benchmark.user.toml
$EDITOR scripts/benchmark/benchmark.user.toml

# Submit all 4 stages (non-interactive)
pixi run python scripts/benchmark/run_benchmark.py

# Collect results after all jobs finish
pixi run python scripts/benchmark/collect_results.py --run-id <RUN_ID>
Results land in output/benchmark/master/run_<RUN_ID>/:
benchmark_results_aggregated.csv— per-stage wall times and speedupsbenchmark_results.{png,svg,pdf}— timing figurebenchmark_speedup.{png,svg,pdf}— speedup figureprovenance_manifest.json— reproducibility metadatascaling_analysis.md— human-readable interpretation
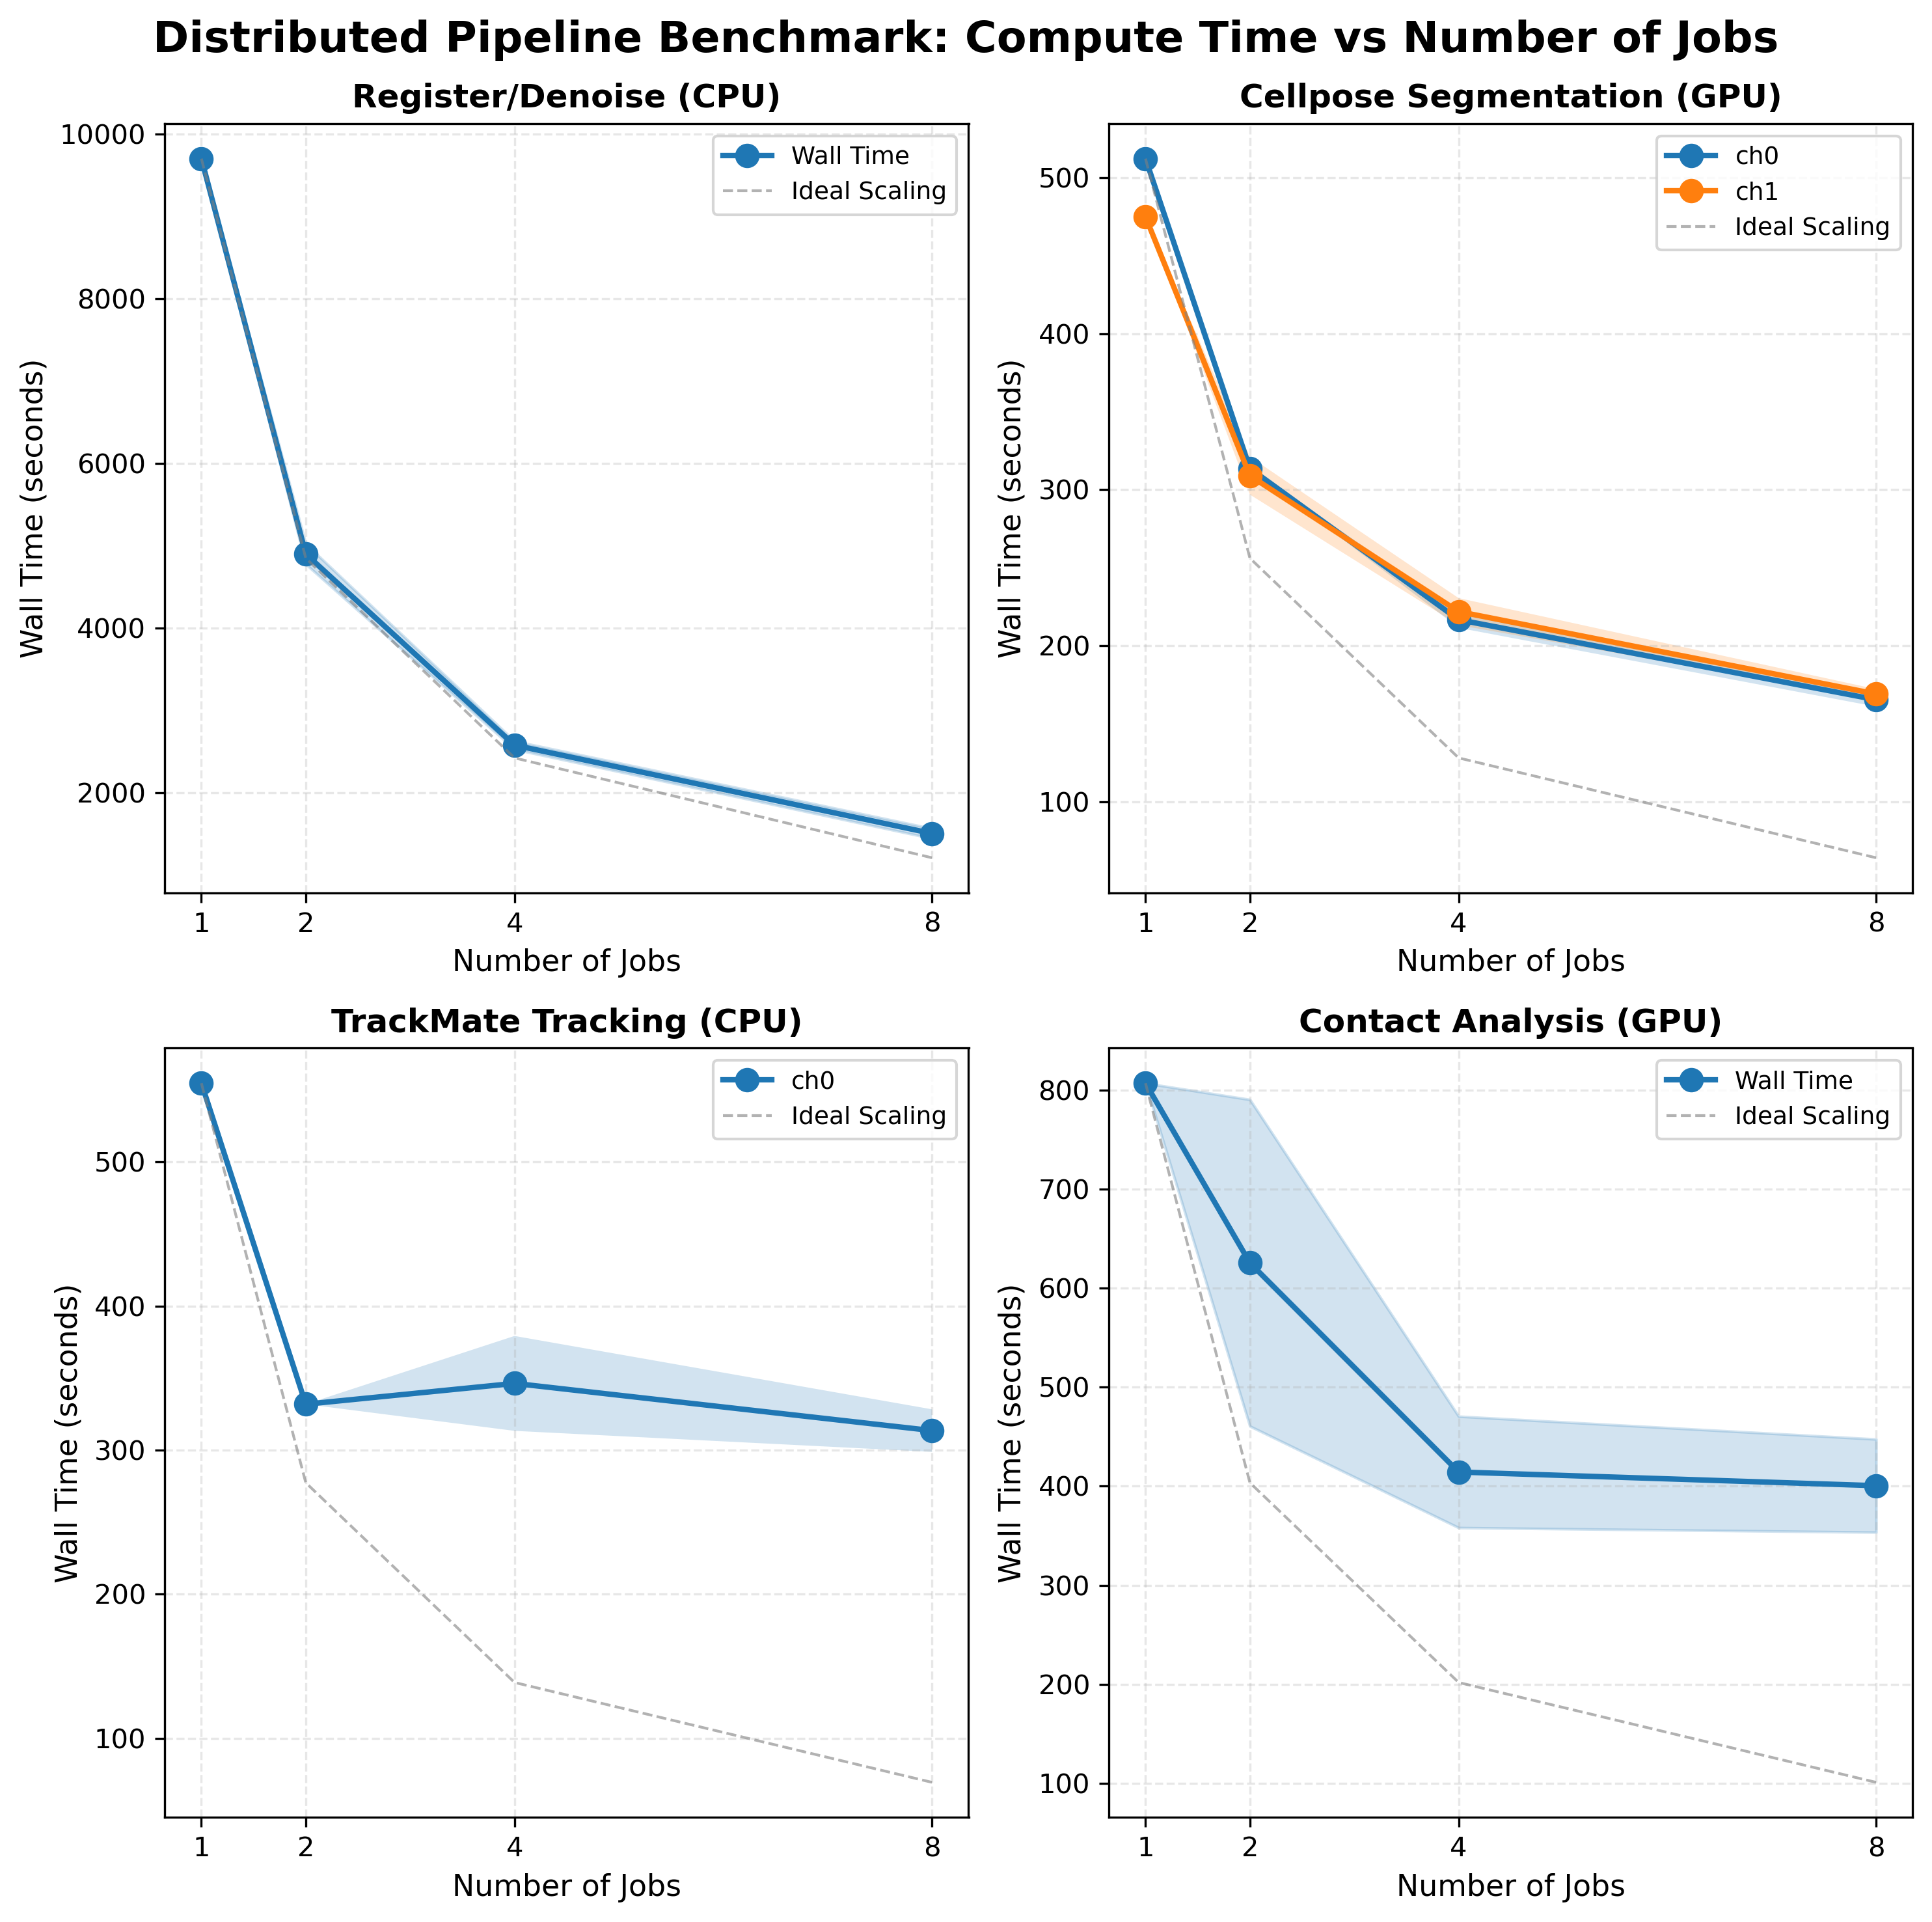
Scaling Results (UTSE dataset, 80 frames, A100 40 GB, run 20260317T114224Z)
Stage |
N=1 (s) |
N=2 (s) |
N=4 (s) |
N=8 (s) |
Speedup @N=8 |
Efficiency @N=8 |
|---|---|---|---|---|---|---|
register_denoise |
9703 |
4902 |
2580 |
1508 |
6.44× |
80% |
cellpose (ch0) |
512 |
313 |
216 |
165 |
3.10× |
39% |
cellpose (ch1) |
475 |
309 |
221 |
169 |
2.81× |
35% |
contact |
807 |
625 |
414 |
400 |
2.02× |
25% |
trackmate (ch0) |
555 |
332 |
346 |
313 |
1.77× |
22% |
Parallel efficiency = speedup / N. Ideal is 100% (linear scaling).
Wall-time figure
Speedup figure
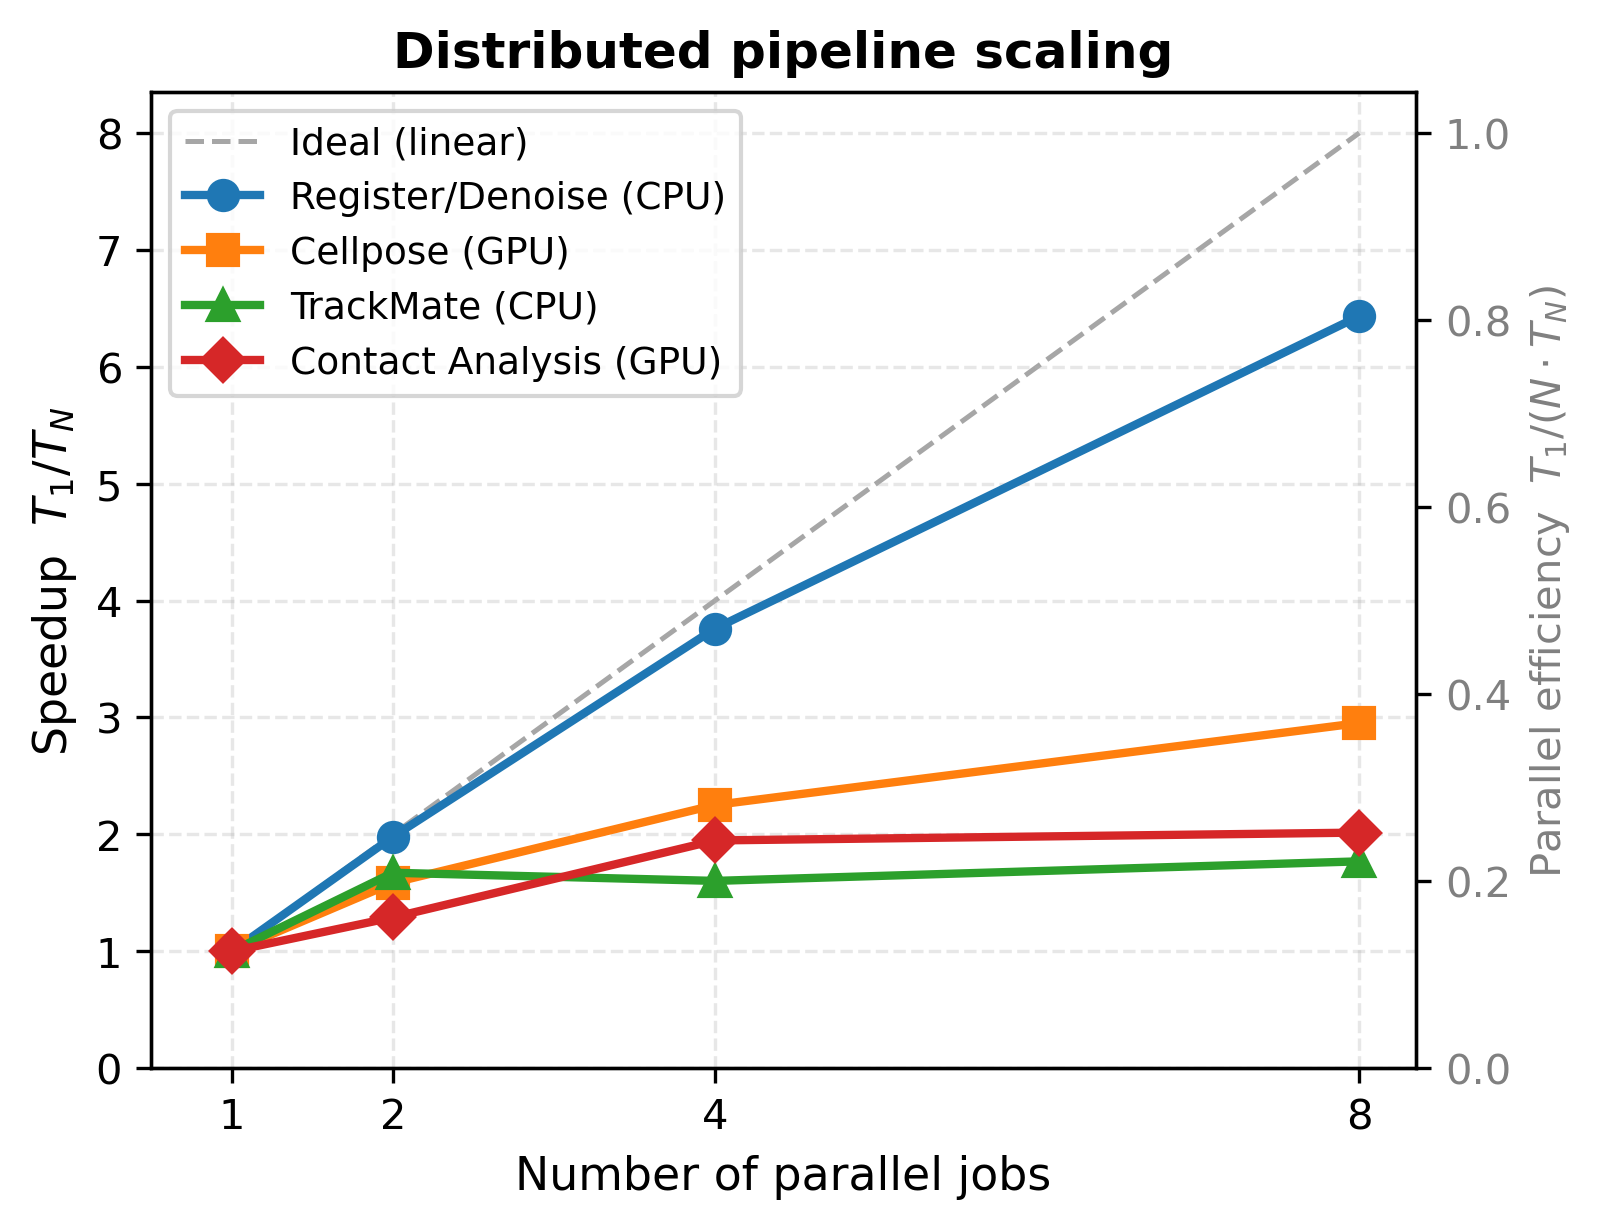
Both figures from run 20260317T114224Z (UTSE dataset, 80 frames, A100 40 GB GPU).
Key Findings
Registration/Denoising — Near-Linear (80% efficiency)
ANTs image registration is an embarrassingly parallel CPU workload. Each frame is registered independently, so doubling workers nearly halves wall time. The remaining 20% loss is from GPFS I/O overhead (loading/writing large TIFFs) and minor load imbalance.
Practical guidance: use N=8 for production runs. Registration dominates serial wall time at ~2.7 hours; N=8 brings this to 25 minutes.
Cellpose Segmentation — Moderate (39% efficiency)
GPU segmentation on an A100 40 GB. At N=1, the GPU is already well-utilised processing a full time-lapse batch. Splitting to N=8 workers means each job sends a smaller frame batch to the GPU — reducing per-batch latency but adding SLURM scheduling and I/O overhead per job. Diminishing returns set in beyond N=4.
Practical guidance: N=4 is the practical optimum (2.36× speedup with lower queue time than N=8).
Contact Analysis — Low (25% efficiency)
Contact detection (Delaunay triangulation, nearest-neighbour search) is primarily CPU-bound with GPU-accelerated pyclesperanto steps. Scaling is limited by uneven contact density across frame windows: frames with dense cell populations take disproportionately longer, creating a straggler that controls wall time.
Practical guidance: N=4 (1.95×) delivers most of the available speedup. N=8 offers marginal improvement (+0.07×) at higher queue overhead.
TrackMate Tracking — Barely Improves
TrackMate achieves only 1.77× at N=8. This is the expected result. Three compounding factors:
Sequential linking constraint: TrackMate links cells across consecutive frames in order within each time window. No intra-window parallelism is possible — only splitting across time windows helps.
JVM startup overhead: each SLURM job starts a fresh Java VM. With N=8 and 80 frames, each job processes 10 frames but still pays full JVM startup cost (~60–90 s). The startup-to-compute ratio worsens as window size shrinks.
Straggler problem: the N=4 wall time (346 s) exceeds the N=2 wall time (332 s). The frame window with the highest cell density and longest tracks takes 346 s to process 20 frames — longer than either N=2 job’s 40 frames (332 s). Splitting concentrates the hard frames in one job rather than averaging them across a larger window.
TrackMate scaling:
  N=2: wall=332s, both jobs: 332s each (std≈0)       ← balanced
  N=4: wall=346s, avg=297s, std=33s                  ← straggler at 346s
  N=8: wall=313s, avg=246s, std=100s                 ← very high variance
Conclusion: TrackMate is the horizontal-scaling bottleneck of the pipeline. N=2 (1.67×) is the practical limit; beyond that, JVM overhead and the straggler effect provide no reliable improvement. GPU-native trackers (e.g. CUDA IoU) would remove this bottleneck.
Stage-Level Guidance
Stage |
Recommended N |
Rationale |
|---|---|---|
register_denoise |
8 |
Near-linear; dominates serial runtime |
cellpose |
4 |
Best speedup-to-queue-time ratio |
contact |
4 |
Most speedup before diminishing returns |
trackmate |
2 |
JVM overhead + straggler; N>2 unreliable |
Benchmark Infrastructure
The benchmark suite lives in scripts/benchmark/:
scripts/benchmark/
├── run_benchmark.py        # orchestrator (submit + poll all 4 stages)
├── collect_results.py      # result collection + validation + plots
├── benchmark_config.py     # config loader + path resolver
├── config/
│   └── benchmark.def.toml  # default config (committed)
├── sbatch/                 # per-stage SLURM submission scripts
└── logs/                   # SLURM output logs
See scripts/benchmark/config/benchmark.def.toml for all configurable
parameters (dataset root, GPU gres, frame count, tolerance thresholds).
For detailed troubleshooting see the operator guide.